
On 12 October we counted how many Amazon and Flipkart prices were at their own lowest in three weeks: 64%, up from 29% before the sale. That was one day. This is the same test, run for every day we have, from 2 October to 14 October.
The share rose for the first three sale days, reached 68% on 10 October, and was 57% on 14 October. Most prices that reached their low stayed there: of 163 prices at their low on 12 October that we could check again on 14 October, 132 still were.
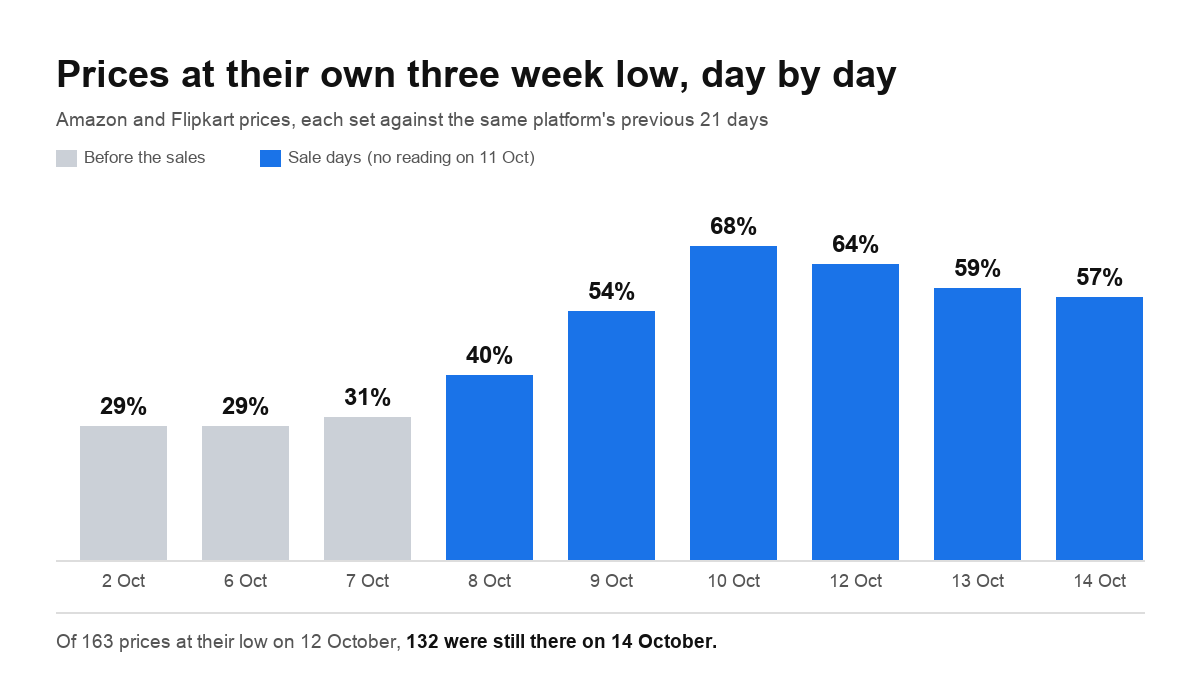
What we measured
The method is the same as on 12 October, so the days can be compared.
- A series is one product on one platform. Amazon is compared with Amazon and Flipkart with Flipkart.
- For each day we take the series' previous 21 days, using the lowest in-stock price on each day we read it. A series needs readings on at least 4 of those days, and its latest reading must be within 5 days.
- A price is at its own low when it is within 3% of the lowest price in that window, and the window's prices ranged by more than 4%. That second condition keeps out products whose price never moves.
- Packs and bundles are left out.
Day by day
| Day | Prices measured | At their own low | Share |
|---|---|---|---|
| 2 October | 268 | 78 | 29% |
| 6 October | 265 | 78 | 29% |
| 7 October | 263 | 82 | 31% |
| 8 October, Amazon's sale opens | 265 | 106 | 40% |
| 9 October, Flipkart's sale opens | 263 | 141 | 54% |
| 10 October | 260 | 178 | 68% |
| 12 October | 261 | 166 | 64% |
| 13 October | 260 | 154 | 59% |
| 14 October | 256 | 145 | 57% |
We didn't read any prices on 11 October, so it isn't in the table.
Why the share settles after the first days
Two things happen once a sale has been running for a few days, and neither is a finding about anyone.
The window catches up. Each day's test looks back 21 days. As sale prices fill more of that window, and the higher prices from before the sale drop out of it, a price that hasn't changed can stop counting. Its window no longer moves by more than 4%, so it is treated like a price that never moves. 7 of the 31 prices that left their low between 12 and 14 October were at exactly the same price on both days.
Some deals run for a set time. The other 24 had a higher latest price on 14 October than on 12 October. Sale prices often come in timed deals and bank offer windows, stock runs out, or the seller offering the lowest price changes. A price that moves up after a deal ends is ordinary sale behaviour.
So the useful number is the steadier one. On every sale day from 9 October on, more than half the prices we measured were at their own three week low.
What this does not tell you
A low isn't the lowest ever. It's the lowest in three weeks, and our history starts on 10 August.
Readings are in rotation. We read each product on some days, not every day, so a latest reading can be up to 5 days old. Between 60 and 140 series were read on each sale day.
It says nothing about value. A product at its three week low can still be dear for what it is, or poorly rated.
Our 2 October count is one higher than published. Rerunning the test gives 268 prices for 2 October where the 12 October piece said 267, with the same 78 and 42. The underlying record for one listing has changed since. None of the counts at a low moved.
To check a single product before you buy, its own page shows its recent prices on each platform, and the pre-sale price record shows what it cost before the sale.
Prices read up to 14 October 2026, each against the previous 21 days on the same platform.