
Amazon's sale is in its third day and Flipkart's in its second. We've already run day one on Amazon and day one on Flipkart, each set against the weeks before the sale.
This is the question we froze two records to answer. Does it matter which one you measure against?
For most products, no. For some, it changes the answer.
What we compared
A series is one product on one platform. We took 198, 109 on Amazon and 89 on Flipkart, because those are the two platforms running these sales. Each has at least five readings in both frozen records, the first from 18 August to 17 September and the second from 17 September to 6 October, plus a price recorded since the sale opened there: Amazon from 8 October, Flipkart from 9 October. The readings are from 8 to 10 October.
Both records keep the lowest price recorded each day, and the usual price is the middle of those. Today's price is the cheapest in-stock offer on the same platform. Amazon is compared with Amazon and Flipkart with Flipkart.
We left out packs and bundles, listings of one product that sat far apart in price, and one series whose two records were more than twice apart, which can't be a real three week move.
Most products didn't change between the records
119 of the 198 stayed within 5% of their August usual price right up to the day before the sale. For those, the record you pick doesn't matter. The typical sale price is 8% below either, and 73 of the 119 are 5% or more below.
The other 79 moved. 26 clearly rose and 39 clearly fell. By clearly we mean that both the usual price in the second record and the last reading before the sale were 5% or more away from the August usual price. A further 14 moved on the usual price without the last reading agreeing, so they're in neither group.
| Between the two records | Products | Sale price against the weeks before | Sale price against August |
|---|---|---|---|
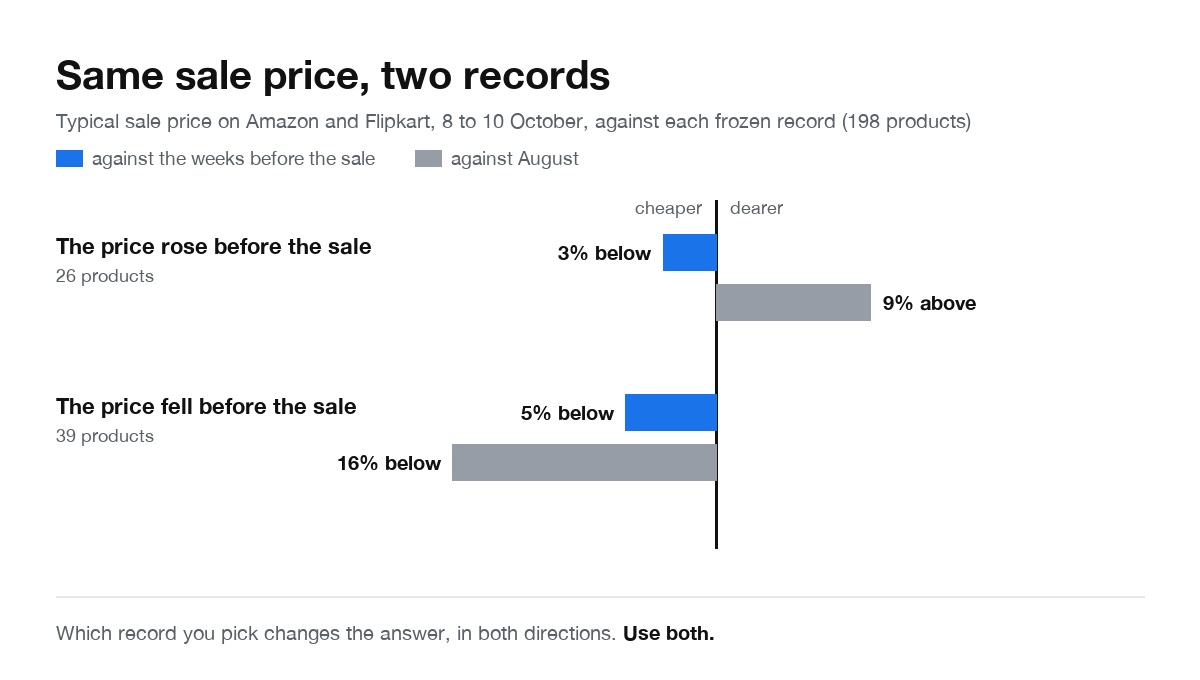
| Price rose | 26 | typically 3% lower | typically 9% higher |
| Price fell | 39 | typically 5% lower | typically 16% lower |
| Stayed within 5% | 119 | typically 8% lower | typically 8% lower |
Typical means the middle value.
If the price rose first
Against the weeks right before the sale, the typical sale price for these 26 is 3% lower. 10 of the 26 are 5% or more lower, 12 are within 5%, and 4 are 5% or more higher.
Against August it looks different. The typical sale price is 9% higher. 15 of the 26 are 5% or more above their August usual price, and 11 are at or below it, give or take 3%.
Three examples, because this group isn't one story.
The Philips QP1624 OneBlade trimmer on Amazon was ₹1,701 in August. Before the sale it sat at ₹1,849 to ₹1,999. On 9 October it was ₹1,379. That's 28% below its usual price in the weeks before the sale and 19% below August, so it's cheaper against both.
The Havells GS8714 grooming kit on Amazon was ₹2,079 through early September, ₹2,521 on 14 September and ₹2,599 from 18 September. On 9 October it was ₹2,499. That's 4% below the weeks before the sale and 20% above where it was in August.
The Vega VHDH20 hair dryer on Flipkart was ₹748 across 17 readings in August and early September, ₹994 from 25 September, and ₹998 on 9 October. Against the weeks before, nothing has changed. Against August, it's 33% higher.
If the price fell first
Against the weeks before the sale, the typical sale price for these 39 is 5% lower. 21 are 5% or more lower, 15 are within 5% and 3 are higher.
Against August it's typically 16% lower, and 36 of the 39 are 5% or more lower. For the typical product here, most of the gap against August was already there before the sale started.
The VGR V581 curler on Amazon was ₹2,699 through early September and ₹2,499 in mid September. It was ₹1,799 from 26 September and ₹1,599 on 8 October. Against the weeks before that's 11% lower. Against August it's 41% lower, and most of that happened a fortnight before the sale.
The Nova NHP8215 hair dryer on Flipkart was ₹1,324 across 16 readings in August, ₹1,322 on 19 and 22 September, ₹1,224 from 26 September and ₹998 on 10 October. That's 18% below the weeks before and 25% below August.
Some of the late September falls may be early deals. We can't see why any single price moved.
What this means for a sale price
Set the sale price against both records, not one. If they agree, either gives the same answer, as they do for 119 of these 198. If they disagree, the gap shows where the cut came from. A price that rose before the sale has more to come back from, and one that fell has less left to give.
Measured only against the weeks before, 83 of the 198 are 10% or more cheaper. Measured against August, 94 are. Neither number is the right one. They answer different questions.
Every product's two records are on the pre-sale prices page, and the test we apply to our own deals page is in what counts as a real deal.
What this does not show
It isn't a finding about anyone. A price can rise or fall because of stock, a seller change, an offer starting or ending, or a change in cost, and from outside they look the same.
A middle value of five readings is thin. That's why we also required the last reading before the sale to agree, and why 14 products that failed that test are in neither group. We checked every example against its daily readings.
It's the first days of the sale. Each product is read once a day at most, and often less, so a price can change within a day and some deals last hours.
The records start on 18 August. A price that was already low in June reads as normal here.
It's a sample. 198 series across mixed categories, only those with enough readings in both records.
Readings from 8 to 10 October 2026, against the records frozen on 17 September and 6 October.