
In September 2026 we found 74 products where the Amazon and Flipkart listings showed a different MRP for the same item. The September edition was frozen on 30 September and will not change, so it can be quoted without the figure moving underneath the citation.
August was 54. Before anyone reads that as a trend, read the next section.
Most of the rise is us
We tracked more in September. The index drew on 9,307 listings against 6,201 in August, across 232 matched products against 197. That's 40 listings per product where August had 31, a 27% deeper look at the same shelf.
A disagreement can only be found where we are looking. More listings per product means more chances to catch one, so a rising count is what deeper coverage produces whether or not anything changed in the market.
As a share of the products carried by both platforms, the index moved from 29% in August to 37% in September. That is a real increase in the rate and not only in the count, but one month against one month, on a sample that grew by a quarter, is not a trend. It is two data points.
The typical gap got smaller
This is the figure that cuts against the headline, which is exactly why it goes near the top.
The median gap between the two declared MRPs fell from 13.5% in August to 11.5% in September. The index got longer and milder at the same time.
| Gap between the two declared MRPs | August | September |
|---|---|---|
| 50% or more | 3 | 5 |
| 25% to 49% | 7 | 12 |
| Under 25% | 44 | 57 |
Four fifths of the index still sits under a quarter, which is consistent with stale catalogue entries nobody has corrected. It doesn't need a more interesting explanation, and the data can't supply one.
The largest single gap is the VGR V055, where the Amazon listing shows ₹1,299 and the Flipkart listing shows ₹3,660. That is 182%, and it is one row out of 74.
Where they cluster
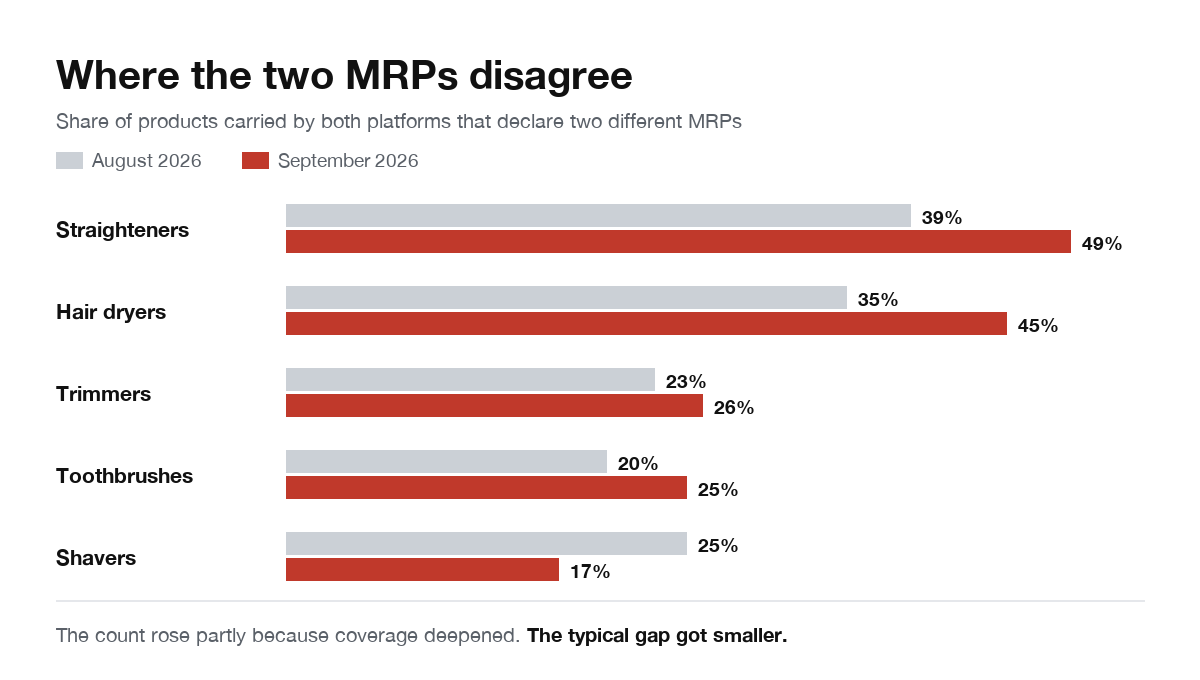
Hair styling stays the concentration. Straighteners and hair dryers are each close to half, trimmers sit at a quarter, and shavers moved the other way.
We report this by category rather than by brand on purpose. A brand with more listings in our sample appears more often for arithmetic reasons, so a brand count measures our coverage rather than the market, and publishing one would invite a conclusion the data cannot support.
Categories with fewer than 10 products on both platforms are left out, because below that the percentage swings on a single row.
Same price, different badge
In 15 of the 74, the selling price on both platforms is less than ₹5 apart. Only the crossed-out figure differs, and with it the advertised saving. That's the same count as August.
| Product | Price on both | Amazon badge | Flipkart badge | Difference |
|---|---|---|---|---|
| HealthSense HM170 | ₹1,399 | 30% off | 0% off | 30 points |
| VGR V596 | ₹799 | 38% off | 60% off | 22 points |
| Nova NHS840 | ₹599 | 40% off | 60% off | 20 points |
| Philips HP6388 | ₹1,492 | 6% off | 25% off | 19 points |
| Caresmith CS356 | ₹1,489 | 20% off | 37% off | 17 points |
These are the clearest rows in the index because the price is held constant. The same money buys the same product, and the only thing that changes is the size of the saving shown.
The first row is the clearest version of it. One listing shows ₹1,399 as 30% off. The other shows the same ₹1,399 as 0% off. Both cannot be describing the same printed figure.
How confident each row is
September grades: 22 High, 33 Medium, 19 Low.
A High row is a code-verified match with enough listings to adjudicate the disagreement. A Low row is a small or single-source gap worth checking, not a finding. The scoring method is published in full, and anything cited from this index should carry its grade.
One number deserves more attention than it usually gets. We can say which platform is wrong on only 4 of the 74 rows. Naming the side that erred needs a third independent declaration of the MRP, and on 70 rows we have two sources saying different things and no way to break the tie.
The higher figure turned up on both sides. The Flipkart listing showed the higher MRP in 52 rows and the Amazon listing in 22. Which side shows the higher figure says nothing about which one is correct.
What the index does not show
Stating this properly is the point of publishing an index rather than a screenshot.
Which of the two figures is wrong, except on those 4 rows. Elsewhere, only that they cannot both be right.
Why. A stale entry, a variant mismatch, a pack revision and an uncorrected seller listing all look identical from outside.
Intent. Nothing here establishes it and nothing here should be read as alleging it.
Batch or pack-revision context. Not visible from a public listing page. The only authoritative check is reading the MRP off the physical pack.
Seller identity. We still don't capture which seller published a listing, or whether it is platform-sold. People with direct catalogue experience have called this the biggest gap in the method, and they are right.
Next edition
The October index will be frozen at the end of the month. It will land in the middle of the festive sales, which makes it the first edition where the declared MRPs are doing real work on the page.
The live report updates whenever the data refreshes, which makes it the right page to browse and the wrong page to cite. The August edition stays where it is.