
In August 2026 we found 54 products where the Amazon and Flipkart listings showed a different MRP for the same item. The August edition was frozen on 31 August and will not change, so it can be quoted without the figure moving underneath the citation.
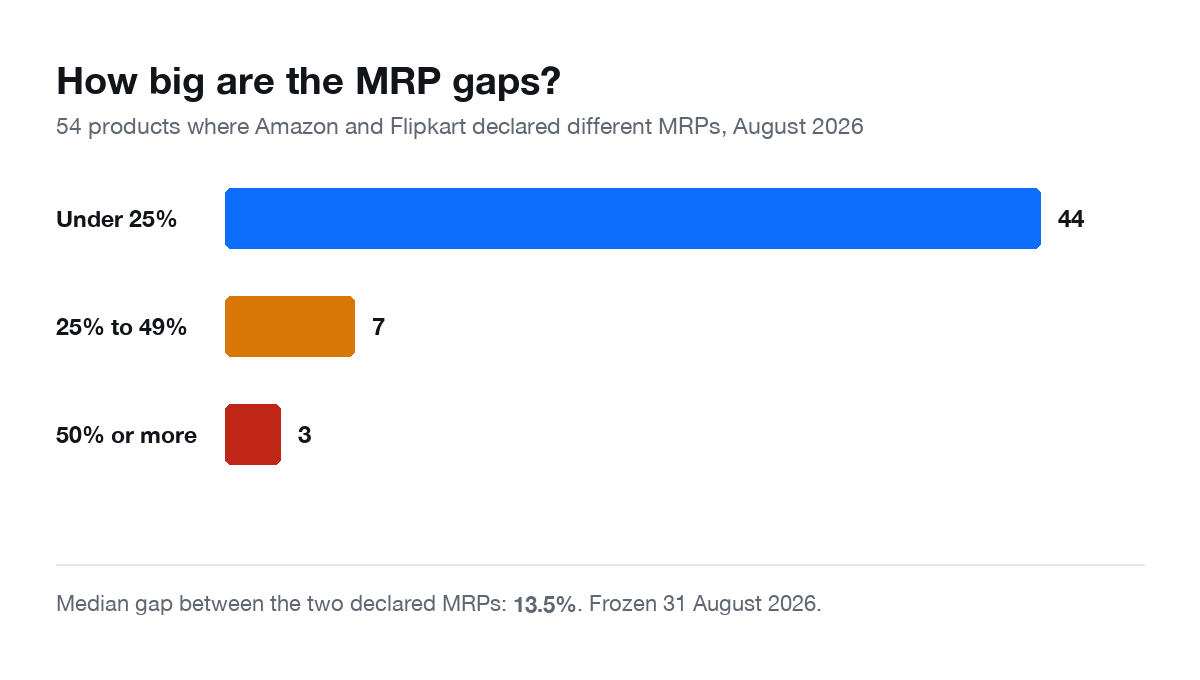
Some individual cases have large gaps. The index as a whole does not. The median gap between the two declared MRPs is 13.5%, and only three products of the 54 differ by half or more. That number matters more than the outliers, because it is what the pattern actually looks like.
This is the first monthly edition. It exists to be checked, so everything below is countable from the table on that page.
What the index counts
A row appears when the same product, matched across both platforms by brand and manufacturer model code, carries a different declared MRP on each.
MRP is a legal declaration under the Legal Metrology Act. It is printed on the pack by the manufacturer, packer or importer, and it is a property of the product rather than of the shop. A product can only have one. So when two listings publish different figures, at least one of them does not match what is printed on the box.
Multipacks are excluded. A twin-pack legitimately carries roughly double the single-unit MRP, and counting those would inflate the index with things that are not errors.
How big are the gaps?
This is the part that gets lost when a single example goes around.
| Gap between the two declared MRPs | Products |
|---|---|
| 50% or more | 3 |
| 25% to 49% | 7 |
| Under 25% | 44 |
Median gap: 13.5%. The largest is the VGR V228 trimmer, where the Amazon listing showed ₹3,999 and the Flipkart listing ₹2,299, a difference of 74%.
So four fifths of the index sits under a quarter. A 13.5% disagreement is consistent with a stale catalogue entry that nobody has corrected. It does not need any more interesting explanation than that, and the data cannot supply one.
Which side shows the higher MRP
The higher figure appeared on both platforms. It was on the Flipkart listing in 38 rows and on the Amazon listing in 16. Which side shows the higher figure says nothing about which figure is correct.
Where the price is identical and only the badge moves
In 15 of the 54, the selling price on both platforms is effectively the same. Only the crossed-out price differs, and with it the advertised discount.
| Product | Amazon | Flipkart | Badge difference |
|---|---|---|---|
| VGR V228 | 53% off | 17% off | 36 points |
| Vega VHSH26 | 2% off | 26% off | 24 points |
| Caresmith CS356 | 20% off | 37% off | 17 points |
| VGR V106 | 3% off | 19% off | 16 points |
These are the clearest rows in the index, because price is held constant. The same money buys the same product, and the only thing that changes is the size of the discount shown.
The reverse case is worth as much attention. On the VGR V055, the Amazon listing showed 64% off at ₹799 and the Flipkart listing showed 74% off at ₹959. The bigger badge is on the more expensive listing, by ₹160.
Which brands appear
| Brand | Rows in the August index |
|---|---|
| Vega | 27 |
| Philips | 9 |
| Havells | 6 |
| VGR | 5 |
| Everything else | 7 |
Half the index is one brand. Read that carefully, because Vega is also the largest brand in our sample, with 57 of the 198 products we currently track. A brand with more listings has more chances to appear. The concentration is a fact about this dataset, not a finding about the market.
What the index does not show
Stating this properly is the point of publishing the index rather than a single screenshot.
- Which of the two figures is wrong. Only that they cannot both be right.
- Why. A stale entry, a variant mismatch, a pack revision and an uncorrected seller listing all look identical from outside.
- Intent. Nothing here establishes it, and nothing here should be read as alleging it.
- Batch or pack-revision context. That is not visible from a public listing page and never will be. The only authoritative check is reading the MRP off the physical pack.
- Seller identity. We do not yet capture which seller published a listing, or whether it is platform-sold or marketplace. Several people with direct catalogue experience have pointed out that this is the biggest gap in the method, and they are right.
How the grades work
Every row carries a confidence grade, so a weak row cannot be quoted as a strong one. In August: 17 High, 25 Medium, 12 Low.
A High row is a code-verified match with enough listings to adjudicate the disagreement. A Low row is a small or single-source gap worth checking, not a finding. The scoring method is published in full.
Anything cited from this index should carry the grade with it.
Next edition
The September index will be frozen at the end of the month and published the same way. The live report updates whenever the data refreshes, which makes it the right page to browse and the wrong page to cite.
If you want the underlying explanation rather than the monthly count, start with why two listings can disagree and how to tell whether a discount is real.