
A star average is one number doing the work of five. It tells you where the middle sits. It doesn't tell you whether buyers agreed.
We pulled the full rating breakdown for every listing we track that carries at least 100 ratings. That is 323 listings across 199 products, read this week. The typical listing has 9% of its ratings at one star.
Among the listings rated 4.0 or better, 66 of 257 have a tenth or more of their ratings at one star. One in four.
The shape the average came from
Take the Philips MG9551 trimmer. Amazon and Flipkart both sell it. The averages are 4.4 and 3.9, which sounds like a small difference in opinion.
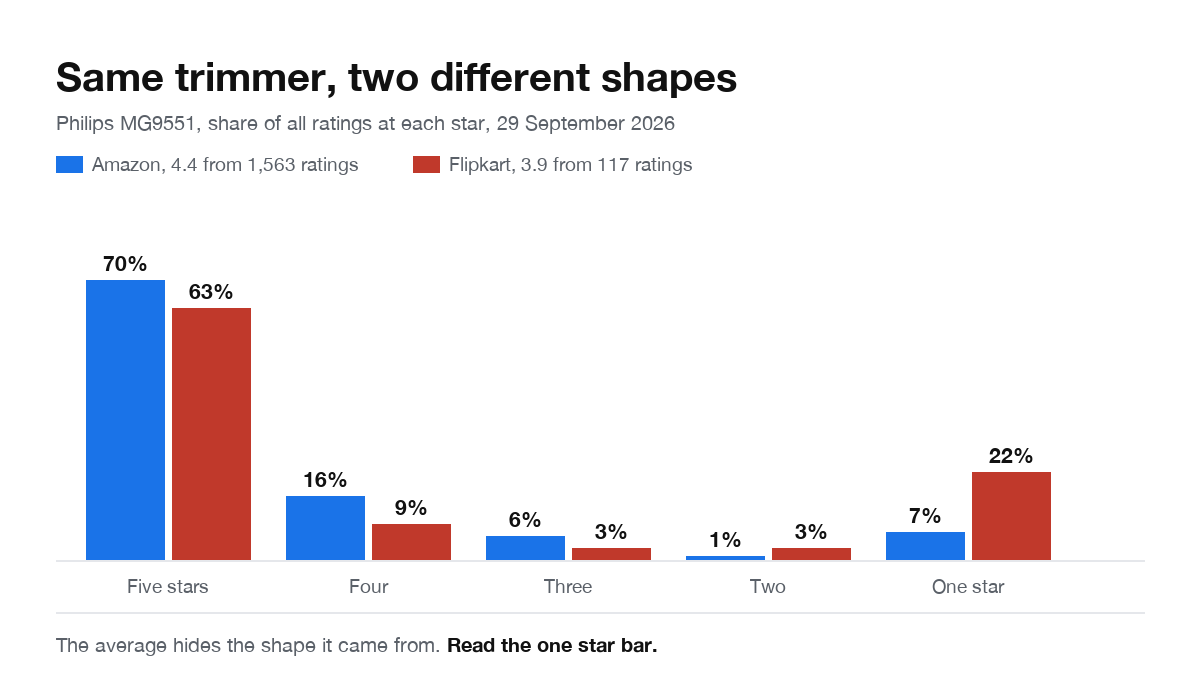
It isn't a small difference. On Flipkart, more than one buyer in five gave this trimmer a single star. On Amazon it is one in fourteen. The share of five star ratings is nearly the same on both, 70% and 63%. Everything that separates the two averages sits in the bottom bar.
That shape has a name worth knowing. Most of the weight is at five, a second lump at one, and almost nothing in between. The average lands at 3.9, where barely anyone actually voted.
It isn't rare
Four more where the same product splits its buyers differently depending on where they bought it:
| Product | One star share | And on the other platform |
|---|---|---|
| VGR V353 shaver | 31% on Amazon, 331 ratings | 16% on Flipkart, 1,646 ratings |
| Caresmith CS356 massager | 13% on Amazon, 1,923 ratings | 6% on Flipkart, 10,610 ratings |
| Philips BHD356 dryer | 13% on Amazon, 1,733 ratings | 8% on Flipkart, 1,172 ratings |
| Philips S3144 shaver | 13% on Amazon, 1,066 ratings | 9% on Flipkart, 1,437 ratings |
Be careful with the first one. A 31% one star share from 331 ratings is a warning worth reading, but the Flipkart figure comes from five times as many buyers, and the two do not have to agree for both to be accurate. Different buyers, different returns experience, different sellers behind the listing.
For most products the two platforms agree closely. Across the 124 products with 100 or more ratings on both, the typical difference in one star share is 2 percentage points. It is the tail that the average hides, and you can't see the tail from the average alone.
The count beside the stars is not always that product's
One more thing the breakdown showed. On 9 occasions, two different models showed the same rating, the same breakdown and exactly the same number of ratings on the same platform. Eighteen of our products are affected.
The clearest one is Havells. On Amazon, the HD3151 dryer and the HD4161 dryer both showed 4.3 stars from 67,860 ratings, down to the same one star share. On Flipkart the two have their own separate pools: 114,448 ratings for the HD3151, and 188 for the HD4161.
So the HD4161 carries a 67,860 rating history on one platform and a 188 rating history on the other. The most likely cause is ordinary, that the platform groups ratings across a family of related models rather than per model, and we're not going to guess beyond that. The consequence for a shopper is the part that matters. A large rating count next to a model isn't proof that many people bought that model.
How to read a rating in ten seconds
Open the breakdown, not the average. Three things:
The one star bar. Under 5% is quiet. Over 10% means a real group of buyers had a bad time, whatever the average says.
The number of ratings, and whether that number is plausible for a model that launched recently.
Whether the middle is empty. Five star and one star with a hollow between them is a product that works perfectly or fails, usually on build quality or on what arrived in the box.
What this does not show
It is a snapshot. Read this week, from listings carrying at least 100 ratings. Products below that are excluded because a handful of ratings can produce any shape at all.
We cannot see who left the rating. Verified purchase status, incentives and returns are not visible to us from a listing page, and all three change what a distribution looks like.
A high one star share isn't proof of a bad product. Delivery damage, a wrong variant sent and a genuine fault all land on the same bar.
Ratings are not the same as the price question. A product can have a solid rating and still carry a declared MRP its own listings disagree about.
The short version
The average is a summary of a shape, and for a quarter of the well rated listings we track, that shape has a lump at the bottom the average quietly absorbs. Open the breakdown and look at the one star bar before you decide.
This is the follow up to how to read product ratings, which covered why the same product carries different averages on different platforms.
Rating breakdowns read on 29 September 2026, listings with 100 or more ratings. Amazon and Flipkart publish a breakdown, so those are the two platforms here.